MRI features of steroid induced medullary osteonecrosis


Clinical History
36-year-old male patient, a known case of Hansen’s disease(Leprosy) on treatment, had suffered an acute episode of erythema nodosum leprosum reaction 1 year ago which was treated with high dose corticosteroids . He presented with pain and swelling in the right knee for 15 days.
Imaging Findings
Patchy ill-defined serpigenous altered signal intensity lesions involving tibial and femoral epiphysis, metaphysis and diaphysis and patella. On T2-Weighted and STIR images, they have a central hypointense area with an outer hyperintense layer and a peripheral hypointense rim (double line sign). On T1-Weighted images, the lesions appear isointense with a peripheral hypointense rim. The above findings are suggestive of osteonecrosis (bone infarcts). Minimal joint effusion is also seen.
Discussion
Osteonecrosis of the bone is described as pathological and radiological changes in the bone secondary to vascular insufficiency due to various causes. When it occurs in the epiphyseal region (subarticular), it is called aseptic necrosis whereas it is called bone infarction in the metaphysis and diaphysis [1]. Many conditions and risk factors are associated with osteonecrosis. Prolonged usage of corticosteroids and alcohol consumption are the most common causes of atraumatic osteonecrosis. Other causes are haemoglobinopathies (sickle cell disease), vasculitides, metabolic / endocrine causes & idiopathic [1, 2].
The pathogenesis of steroid induced osteonecrosis consists of ischemic injury in the bone and marrow due to increased intraosseous vascular compromise. This is secondary to steroid induced increased bone marrow pressure and also due to fat microemboli. In the epiphysis, this leads to mechanical instability causing microfracture of subchondral trabeculae and subsequently articular collapse and secondary osteoarthritis [2, 3]. Similar pathogenesis also occurs in metaphyseal and diaphyseal osteonecrosis. Pathologically it is characterised by a central zone of avascular cells, middle zone of ischaemic area and reactive hyperaemia and a peripheral zone of normal bone with osteoblastic response referred to as creeping apposition [4].
Conventional radiographs are the least sensitive modality to detect early stages of the disease. A crescent-shaped subchondral lucency (crescent sign) may be seen in late stages of epiphyseal osteonecrosis and irregular sclerotic foci in medullary osteonecrosis [1, 3]. Bone scan shows lack of uptake in early stages but lacks specificity. MRI is the most sensitive and specific imaging tool for the detection and staging of the disease. The central necrotic zone appears hypointense on T1 and T2-Weighted sequences. On T2-Weighted sequences at the junction of viable and nonviable tissues, there is an inner high signal intensity area (vascularised granulation tissue) and an adjacent outer hypointense rim (sclerotic area) called as “double line sign”. This finding is diagnostic of osteonecrosis [4, 5].
Osteonecrosis must be distinguished from other pathological processes including neoplasms. Enchondromas are close differential diagnosis for medullary osteonecrosis. On MRI, enchondromas are well circumscribed, lobulated lesions which are hypointense on T1-Weighted images. On T2-Weighted images, enchondromas appear hyperintense with multiple central hypointense foci of calcifications [5].
Imaging morphology combined with a history of prolonged steroid intake in this case corresponds to the classical findings of osteonecrosis. Knowledge of imaging findings on MRI helps to make the correct diagnosis and avoid further unnecessary investigations/procedures.
Differential Diagnosis List
Final Diagnosis
Steroid induced medullary osteonecrosis
Liscense
Figures
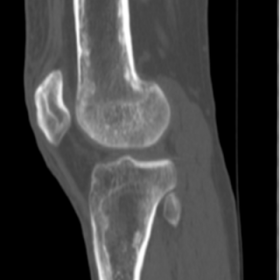
CT

T1W MRI


T2W MRI


STIR


Imaging Findings
According to the provided CT and MRI images, abnormal bone marrow signal can be seen in the distal femur and proximal tibia of the right knee joint. On CT, there is disorganized trabecular distribution, and local sclerotic lesions interspersed with some low-density areas can be observed. On the MRI T1-weighted sequence, the lesion mainly shows low signal, while on the T2-weighted sequence, the “double-line sign” (an inner hyperintense band and an outer hypointense band) is visible, suggesting the interface between necrotic bone and surrounding viable bone. Preliminary observation of the articular cartilage surface does not reveal extensive collapse, though there are localized subchondral changes. There is no clear evidence of a large soft tissue mass, and joint effusion is not clearly displayed or is only minimal. Overall, these imaging findings are consistent with subchondral avascular necrosis of the distal femur and proximal tibia.
Possible Diagnoses
-
Steroid-induced Avascular Necrosis (AVN)
Given the patient has a history of long-term or high-dose corticosteroid use, this aligns with the typical mechanism of steroid-induced bone necrosis. The “double-line sign” observed on imaging is a classic finding. -
Bone Infarction
Bone infarctions in the diaphysis or metaphysis may show similar findings of ischemic necrosis, but considering the history of high-dose corticosteroid use, AVN is more likely. Bone infarctions commonly appear in the deeper marrow region of the metaphysis, characterized by irregular sclerosis and cystic changes on imaging. -
Enchondroma
Enchondromas can present with abnormal signals within the medullary cavity; however, on MRI, they are often lobulated with high signal intensity and scattered low-signal calcifications. This does not fully match the necrotic changes and “double-line sign” evident in this case. Combined with the clinical history of steroid use, enchondroma is less likely.
Final Diagnosis
Taking into account the patient’s history of chronic corticosteroid use, clinical manifestations (knee pain), and the characteristic “double-line sign” on MRI, the most likely diagnosis is steroid-induced avascular necrosis (subchondral necrosis) of the distal femur and proximal tibia of the right knee.
Treatment Plan and Rehabilitation Program
Treatment Strategy:
1. Reduce or discontinue the high-dose corticosteroids responsible for bone necrosis, under the guidance of a specialist, adjusting the dosage step by step.
2. In the early stage, consider reducing weight-bearing on the affected limb, such as using crutches or braces. If necessary, use pain relief and cartilage-protecting medications.
3. For patients with more severe lesions, such as significant cartilage collapse or functional impairment, surgical interventions (e.g., core decompression, bone grafting, or joint replacement) may be considered based on the specific situation.
Rehabilitation and Exercise Prescription:
Rehabilitation training should follow the FITT-VP principle (Frequency, Intensity, Time, Type, Progression, Volume), with a gradual and individualized approach. An example is as follows:
-
Early Stage (Acute phase or when pain is prominent):
- Frequency: 3–4 times per week.
- Intensity: Primarily basic joint mobility exercises and low-intensity muscle strength training, avoiding a marked increase in pain.
- Time: 20–30 minutes per session; high-frequency, shorter sessions can be an alternative.
- Type: Non-weight-bearing or partial weight-bearing exercises, such as straight leg raises or wall squats (depending on pain and joint status).
- Progression: Gradually increase exercise duration and difficulty without exacerbating pain.
-
Intermediate Stage (Symptom relief or early bone healing):
- Frequency: 4–5 times per week.
- Intensity: Under monitoring of pain and joint range of motion, resistance exercises (with resistance bands or light weights) can be gradually increased.
- Time: 30–40 minutes per session.
- Type: Exercises to improve range of motion (e.g., seated leg lifts, lower limb strengthening), and water-based exercises under professional guidance to reduce joint load.
- Progression: Increase weight-bearing and repetitions progressively, closely observing the joint response.
-
Late Stage (Functional recovery and strengthening):
- Frequency: Around 5 times per week, with moderately reduced rest intervals if appropriate.
- Intensity: Gradually progress to moderate-intensity lower limb strengthening exercises, combined with balance, coordination, and proprioception training. If recovery is good, light aerobic exercises may be introduced.
- Time: 40–60 minutes per session.
- Type: Lower limb strength exercises (e.g., half-squats, lunges), slow walking or jogging on a treadmill (upon evaluation and approval by a physician or therapist).
- Progression: Increase intensity and duration based on functional recovery, avoiding sudden or excessive loads that could cause re-injury.
Throughout the rehabilitation process, closely monitor any changes in joint pain, swelling, and function. If a significant worsening or unusual condition arises, seek medical advice promptly and adjust the training plan.
Disclaimer: This report is a reference-based medical analysis formulated from the available information and is not a substitute for an in-person consultation or professional doctor’s diagnosis and treatment. If you have any questions or if your symptoms worsen, please seek medical attention promptly.
Human Doctor Final Diagnosis
Steroid induced medullary osteonecrosis