Talus: An unusual site for osteoid osteoma


Clinical History
17-year-old male patient with chronic pain in the right ankle, without pathological or traumatic history. The pain partially improves with non-steroidal anti-inflammatory drugs and is exacerbated by palpation and during nighttime. Laboratory analytics are within normal limits.
Imaging Findings
Non-contrast CT and MRI ankle scans were performed using T1, T2, PD, and fat-suppression sequences in a Philips Ingenia 1.5T high-field MRI scanner and a Philips Incisive 128-slice CT scanner.
Initial MRI shows talus bone marrow oedema, anterior talofibular ligament’s partial tear, and increased joint fluid (Figures 1a and 1b). The CT scan shows cortical deformation in the distal and dorsal aspects of the talus associated with the talar beak (Figures 2a and 2b). The scintigraphy showed radiotracer uptake in the tibiotalar joint, extending up to the tibia, distal fibula, and tarsus (Figure 4). Control MRI scan revealed a T1 hypointense cortical lesion with a 6 mm maximum diameter, adjacent to the talar beak (Figures 5a and 5b). This lesion shows relaxation times similar to articular cartilage in cartilage mapping, suggesting a chondral matrix inside (Figure 6).
Discussion
Osteoid osteomas (OO) are non-malignant bone tumours, with a 3:1 male-to-female presentation ratio. Usually, the diagnosis is made in the age range of 5 to 25 years [1–3].
OO represents 19.4% of all non-malignant bone tumours, with the talus being the fourth most commonly affected bone, occurring between 2% and 10% of cases [4]. These tumours rarely reach diameters greater than 1.5 cm [1,2].
The clinical presentation is local pain, most severe at night, swelling, and stiffness during daily activities, with temporary relief with non-steroidal anti-inflammatory drugs (NSAIDs). Local hypersensitivity and oedema are commonly observed because of the tumour hypervascularity and the consequent prostaglandins production [1–3].
OO are classified into 3 histological types: cortical, spongy, and subperiosteal. In long bones, OO tend to appear in cortical bone and cause an excessive subperiosteal reaction. In the short and flat bones of the foot, OO typically appears in spongy and subperiosteal location, without a significant subperiosteal reaction [3,4].
The misinterpretation of the initial symptoms often leads to a diagnostic delay, being the average time for the manifestation of these symptoms in the range of 1 to 2 years. This lapse of time between clinical presentation and diagnostic confirmation highlights the importance of a careful evaluation and the use of multiple imaging scans to achieve accurate identification of OO [1,2]. The typical nidus is seen in 62.2% of cases, which makes it difficult to diagnose and may require up to four scans in specialised centres for confirmation [1,2].
In this context, CT scan is superior to MRI scan, with MRI failing to make the diagnosis in 33% to 35% of the cases of suspected osteoid osteoma, therefore CT scan is the gold standard diagnostic method [1,2,4]. CT scans can identify a highly mineralised tumour focus, surrounded by a hyperdense sclerotic area up to 1 cm, while MRI shows bone marrow oedema and adjacent tissue lesions. Bone scintigraphy provides a metabolic evaluation of the lesion and may also be useful to differentiate it from other diseases [5].
MRI scans, as a non-invasive method, allow an early evaluation of cartilage changes, due to their ability to quantify structural modifications. T2 mapping is known to be sensitive to both the organisation of the collagen matrix and the water content of cartilage, increasing the signal when there is disorganisation of the collagen matrix. A cartilage mapping was performed on the patient, which showed T2 values consistent with normal cartilage [6].
Informed consent was obtained from the patient for publication.
Differential Diagnosis List
Final Diagnosis
Osteoid osteoma
Liscense
This work is licensed under a Creative Commons Attribution-NonCommercial-ShareAlike 4.0 International License.
Figures
Right ankle MRI (9 Sept 2023)


Right ankle CT (20 Sept 2023)

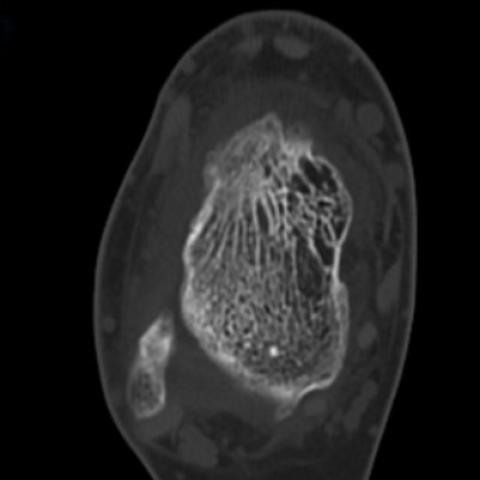
Right ankle CT (15 Nov 2023)


Scintigraphy (27 Oct 2023)

Right ankle MRI (17 Nov 2023)


Cartilage mapping (17 Nov 2023)

1. Imaging Findings
Based on the provided MRI and CT images, a small area of high-density sclerosis is observed in the right talus (ankle region), with a possible low-density lesion in the center (suspected “fissure” or “small cavity” appearance), along with a certain degree of bone marrow edema. A bone scan also indicates a localized hot spot (an area of increased metabolism) in the right ankle. MRI sequences reveal mild edema in the surrounding soft tissue, though no obvious soft tissue mass or malignant infiltration is noted. Overall, the images exhibit a typical pattern of sclerotic bone surrounding a small “cavity” (the so-called “nidus”) and some reactive bone changes, aligning with the characteristics of a benign bone tumor.
2. Potential Diagnoses
-
Osteoid Osteoma
Considering the patient’s age (adolescence), pain worsening at night and relieved by NSAIDs, and imaging evidence of a “nidus,” osteoid osteoma is the most likely diagnosis. Osteoid osteomas commonly measure less than 1.5 cm in diameter, often occur in individuals aged 10–25, and the talus is one of the more frequently affected sites. -
Chronic Osteomyelitis
However, the patient has no notable trauma or infection history, normal blood indicators, and no persistent fever or systemic symptoms. Imaging does not show extensive cortical destruction or apparent sequestra/abscesses. Therefore, chronic osteomyelitis is less likely. -
Bone Cyst or Cartilaginous Lesion
Certain benign bone cysts (e.g., early giant cell tumors, simple bone cysts, etc.) might also present with lytic lesions, but their structure and reactive sclerosis patterns are typically not as characteristic as those of an osteoid osteoma, and the classic nighttime pain relieved with NSAIDs is less common. Considering the clinical presentation, these possibilities are less likely.
3. Final Diagnosis
Integrating the chronic ankle pain during adolescence (worse at night, relieved by analgesics), imaging features (sclerotic band encircling a central small lucent focus on CT, localized hot spot on bone scan), and the classic clinical presentation of an osteoid osteoma, the most probable diagnosis is:
Osteoid Osteoma
4. Treatment Plan and Rehabilitation
-
Treatment Strategies:
- Conservative Treatment: For patients with milder symptoms, NSAIDs (non-steroidal anti-inflammatory drugs) can be used to relieve nocturnal pain and reduce inflammatory responses. Regular imaging follow-up is necessary to monitor changes in the lesion.
- Minimally Invasive Intervention: CT-guided radiofrequency ablation (RFA) or laser ablation can be employed to locally inactivate the lesion. These procedures are less invasive, offer quick postoperative recovery, and can effectively alleviate pain.
- Surgical Excision: In cases where the lesion is more superficial or significantly impairing joint function, surgical removal can be considered. Care should be taken to preserve normal bone and joint structures. Postoperative rehabilitation should focus on appropriate weight-bearing and restoring joint function.
-
Rehabilitation and Exercise Prescription:
-
Early Stage (1–2 weeks post-treatment/surgery):
- Focus primarily on maintaining a basic range of motion (ROM) for the ankle joint. Incorporate passive or active movements without weight-bearing to prevent adhesions and stiffness.
- If pain permits, start gentle muscle-strengthening exercises (e.g., isometric foot exercises) under the guidance of a physician or therapist to promote local circulation.
-
Middle Stage (2–6 weeks post-treatment/surgery):
- Gradually increase both the range and intensity of ankle movements. Use resistance bands or other tools to strengthen the muscles around the ankle with exercises such as plantarflexion/dorsiflexion and inversion/eversion.
- If the lesion is stable and pain has subsided, introduce partial weight-bearing exercises (e.g., short periods of walking or static standing with crutches), being careful to avoid excessive load.
-
Late Stage (after 6 weeks to several months):
- Depending on imaging and clinical recovery, gradually resume normal walking and low-impact running/jumping if there is no significant pain. Slowly increase the duration and intensity.
- Focus on improving balance, coordination, and proprioception (e.g., single-leg stance, balance board exercises, and progressively faster treadmill training) to restore full ankle function.
- If the patient is an athlete or has higher exercise demands, incorporate sport-specific drills in the later phase to improve agility and explosive power incrementally.
- Throughout the rehabilitation process, follow the FITT-VP principle (Frequency, Intensity, Time, Type, Volume, Progression). All exercises should be carried out under the guidance of a physical therapist and physician to ensure safety and efficacy.
- If pain worsens or ankle swelling occurs, seek medical evaluation promptly and adjust the rehabilitation plan as necessary.
-
Early Stage (1–2 weeks post-treatment/surgery):
Disclaimer: This report is based on the current imaging and patient history, and is for reference only. It cannot replace an in-person consultation or professional medical opinion. The specific treatment and rehabilitation plan should be determined by specialists in consideration of the patient’s individual condition.
Human Doctor Final Diagnosis
Osteoid osteoma